


Your New Best Friend in Crypto Trading
What a Backtest of Crypto Breadth Indicators Revealed
Author’s note: Bitcoin is currently down 3.8% as it follows Altcoins lower. If you’ve been reading the past few posts I’ve made, you were fully aware of the dynamics at play between Altcoins and Bitcoins, and why it is likely that Altcoins will crush further as the year progresses. If you haven’t. In light of what’s going on, I’ve decided to unlock this post. If you don’t want to read it, it basically shows that Altcoin breadth is a good predictor of Bitcoin. Here are the accompanying posts:


I will update this post later with the present crypto breadth levels, but I don’t have an active CMC subscription so the data I’ll use (from scraping) may not be as accurate.
Consider upgrading to paid to unlock paywalled posts, get supplementary stuff like data and indicators, and support future research. I have a lot in the works that could be equally helpful. There’s an ongoing 20% discount that expires Feb 5th.
It’s taken for granted that a crypto rally tees off when Bitcoin starts to rally just like it’s widely believed that cryptocurrencies generally do what Bitcoin does. We find this easy to believe because the Bitcoin gets significantly more press. But the same thing happens in equities. When the S&P 500 goes up, few but savvy market participants care what its constituents are doing. But even worse than the excessive press is a misleading chart of Bitcoin’s market cap versus the combined market cap of all other crypto—the ex-BTC market cap—like the one below. At the start of a rally, Bitcoin’s market cap rises before the ex-BTC market cap. To see why this doesn’t imply that Bitcoin is leading, consider that market cap is price x supply. Since Bitcoin’s price is considerably higher than Altcoins, its market cap moves dramatically for smaller changes in its price. For example, a 10% price increase in Bitcoin priced at 60,000 adds 6,000 to its value, while a 10% increase in an Altcoin priced at 1 adds only 0.10. So Altcoins could be outperforming in percentage terms while Bitcoin’s market cap is ‘leading’.

If Bitcoin doesn’t lead Altcoins, then the idea of a 'Bitcoin factor'—where all coins are exposed to Bitcoin—may be misguided. It could be that a 'Crypto factor' drives the crypto market, similar to risk-on/risk-off sentiment in traditional markets When it is on, crypto starts to rally.
I began to question this belief when I made an index of the top 100 Altcoins (excluding stablecoins and wrapped coins) and indexed it to the same price as Bitcoin on Feb 1, 2015 for comparison. I sanity-checked my calculations by first replicating the CMC 100 index published by CoinMarketCap.com. You can see from the chart that while there is a small replication error (it’s difficult to get the exact same weights as CMC), the methodology I used is correct.

I’ve charted this index along with Bitcoin below. It shows that Altcoins started the first major crypto rally. Investors began to warm up to crypto in 2015—Crypto factor on—and started speculating on Altcoins. As more and more coins were introduced, Bitcoin gained its status as the original and most credible coin. So when newbies thought of buying crypto, they chose Bitcoin, and that explains it’s delayed rally in the first major crypto bull market. In the subsequent rallies, sometimes Bitcoin moved first, sometimes Altcoins did—but more often than not, they moved in sync. This supports the idea of a ‘Crypto factor’ rather than a ‘Bitcoin factor’.

Even if you are skeptical the idea of a crypto factor, during a crypto rally or decline, Bitcoin and Altcoins are highly correlated. This makes breadth indicators suitable for timing the start and end of a rally. Using the percentage of coins above their 50-, 100- and 200-DMAs to measure crypto’s breadth, I backtested different thresholds as entry and exit signals for both long and short positions. I didn’t have to include short positions but I wanted to showcase the quality of the indicator’s signal. If you want to be technical about it, assume this strategy is meant to be replicated via Crypto CFDs. CFDs allow traders to profit from price differences allowing them to take both long and short positions (several brokers offer crypto CFDs). You can also short crypto using futures and options, but the results of this strategy would change due to payoff considerations in these assets. Since my focus is on the quality of the signal, I ignored transaction costs due to the difficulty of estimating them for each coin, however, the number of trades is small enough that transaction costs would not significantly change the results.
Percentage of Coins Above Their 50-, 100-, and 200-DMAs
The indicators are easy enough to understand—they simply count how many coins are above their respective daily moving averages (DMAs). I used the a sample of 8301 coins. The 50-dma one moves the fastest and has the most oscillations. The longer the horizon, the fewer the oscillations, and the slower the indicator in capturing the trend. So the 100-dma one is slower and the 200-dma one is the slowest.
Crypto trading is about sentiment, and proverbially, nothing changes sentiment like price. When coins start to go up, they trigger FOMO and a search for the next big coin—further fueling the rally. The percentage of coins above their 50-dma is therefore perfect to find out just when a critical mass has been reached to safely call the start or end of a rally. It is particularly effective in crypto because of it captures momentum and to sentiment.


I also consider the 100- and 200-dma versions. Breadth indicators are often more insightful when you also look at the corresponding price changes. In a case where a crypto rally starts slow, the percentage of coins above their 100- and 200-dmas would be good timing tools.
Bitcoin
Percentage of Coins Above Their 50-DMA
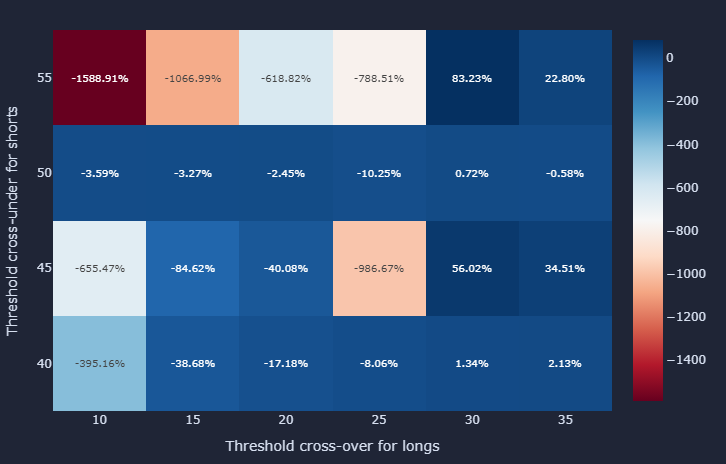
This matrix shows the returns from going long on a cross-over and short on a cross-under of the specified thresholds. For example, if 20% of Altcoins are above their DMAs, a long entry is established if the next day’s breadth is higher (i.e. it crosses over 20%). This trade is closed when the indicator crosses over the 80% threshold. Then, when the indicator crosses under 80%, a short entry is established and closed when it crosses under the 20% threshold.

The matrix shows that the 80% threshold is best for long exits and short entries. There is a stark difference where the returns are negative if the 75% and 70% threshold are used instead. This shows that a Bitcoin rally is close to its end when 80% of coins are above their 50-DMAs. Longs should be closed and shorts opened. Any higher threshold is also profitable, but the 80% line outperforms the higher thresholds.
The optimal strategy is to use the 20% and the 80% thresholds together. It had a return of 847% from 2015-2024. This is likely because these thresholds capture the majority of the move in crypto rallies and declines.
Another good strategy is to go long or close shorts when 30% of the coins are above their 50-DMAs and exit the longs or start shorts when 75% of the coins are above their 50-DMAs. These thresholds likely capture short-term cycles.
In the chart below, you can see the trades, PnL, drawdowns, and cumulative returns of the best-performing strategy; the one with 20% and 80% as the thresholds. You can see that the long positions are established early and held until the bull market clearly ends. The drawback is that you would have round-tripped the tops of the cycles, but it also ensures that you are invested during the whole cycle. Since Bitcoin has been rising each year, more longs than shorts are profitable. The chart showing PnL shows that the winning trades perform very well and the losing trades are have small losses.
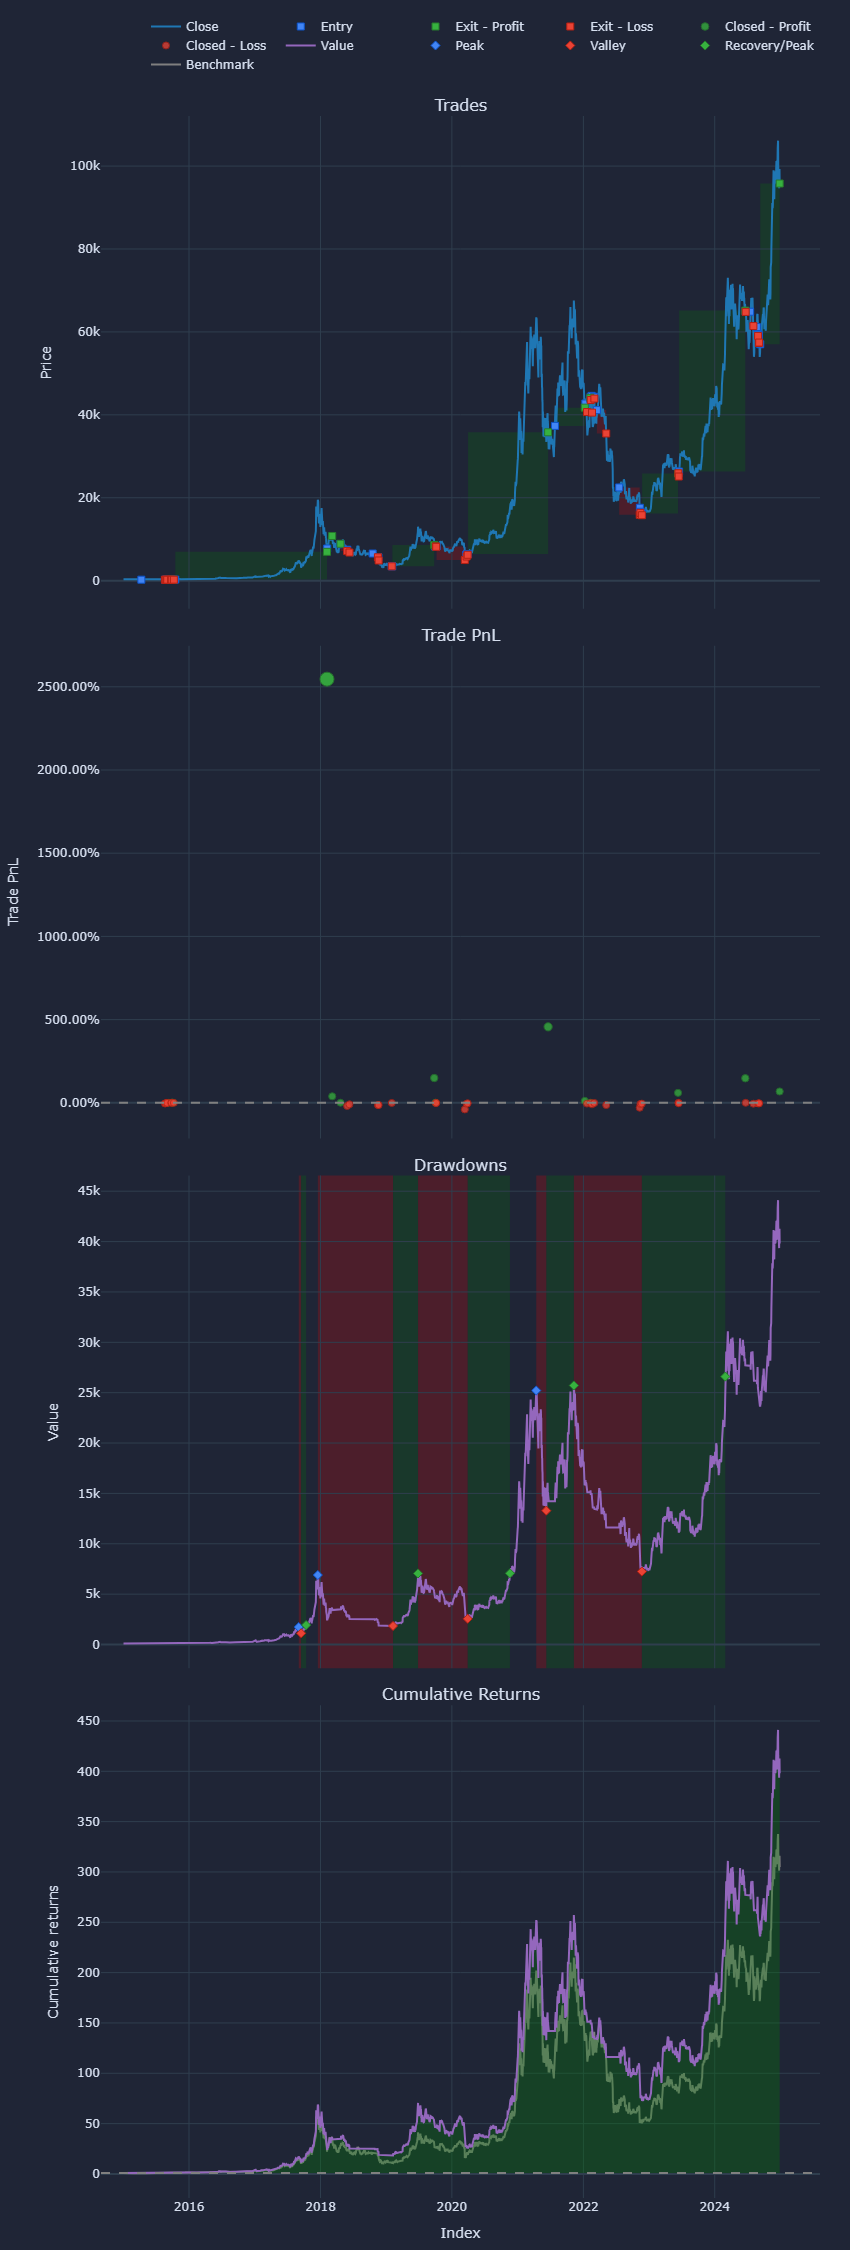
Because this strategy round-trips the tops, the drawdowns are significant, but the cumulative returns show that it significantly outperforms buying and holding Bitcoin. The table below gives further statistics. $100 invested in this strategy would have accumulated to $19,004.62 at the end of the 10 years. 76 trades were placed. Due to the numerous shorts that didn’t work out, the strategy has a win rate of only 35%. Its best trade gained 962% and its worst trade lost 59%.
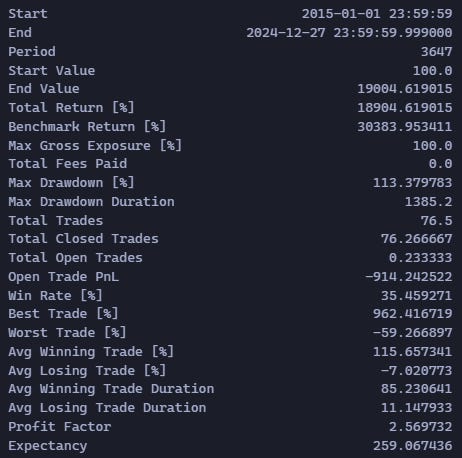
One drawback of this strategy is that it has a maximum drawdown of over 113% with a duration of 1385 days ( or about 3.8 years). The over 100% drawdown sounds perplexing because it means you lost 100% of your capital, but VectorBT calculates drawdowns based on gains. Say you start with $100 and grow it to $20, 000. That’s a 2000% gain. A 113% drawdown is -$2,600. This drawdown happened from late 2021 to early 2023 when Bitcoin depreciated significantly, but a trader following the strategy would have seen a smaller loss than a Bitcoin holder during this period.
Percentage of Coins Above Their 100-DMA

Here again we see the 80% threshold separating night and day in the returns. The three rows of similar returns at the 80, 85 and 90% thresholds are because these thresholds are never crossed under i.e. the indicator never goes over 80% and then back below it. So the longs started at different thresholds are held to the end of the period. This explains the diminishing returns as you increase the long-entry thresholds. The optimal long-entry point is the the 10% threshold.
The optimal long-short strategy uses the 10% and 70% thresholds. It suffers the same problems as the 50-dma indicator. it round-trips the tops and has worse exits than the 50-dma version, and since Bitcoin has been on an unprecedented run over the past decade, shorts simply didn’t work. Its cumulative returns outperform a buy-and-hold strategy but the majority of the strategy’s gains came from one trade.

This strategy also suffers significant drawdowns that follow a drop in Bitcoin’s price. The maximum drawdown is 98% and it lasted 1586 days. 55 trades were taken. The best trade gained 671% while the worst one lost 56%. The strategy also has a win-rate of 35% like the 50-dma version. A winning trade takes 87 days while losing trade takes 10 days. $100 invested in the strategy returned $9912 over the 10 years—roughly half the return of the 50-dma version.

Percentage of Coins Above Their 200-DMA
Out of the 24 combination of thresholds, only 5 had positive returns and only 2 returns more than 1%. This is because Bitcoin moves quickly, and the 200-DMA is always late to the party.

In the charts below I show the performance of the strategy with 35% and 55% as the thresholds. The entries are actually not bad, but the exits take way too long. There are about as many longs as there are shorts and the strategy performed well during the 2015 Bitcoin rally but then it crashed and never recovered.

The strategy has a higher win rate than the other two (39%)and the best trade outperformed the worst trade. The best trade gained 408% and the worst trade lost -202%, while the avg winning trade gained 58% while the avg losing trade lost 20%. However, the strategy had a large drawdown (726%) and never recovered.

Altcoins
Percentage of Coins Above Their 50-DMA
The returns in Altcoins is staggering—the optimal strategy gained 5 digit percentage returns, and all but two of the +ve return combinations are 4 digit percentages.. $100 invested in this index would be worth $500k+ as of December 2024. The reason the returns are so high is because of the Altcoin really in 2017-18. If you look at the chart at the start. The Altcoin index made a high over 160k and has never reached that level again.
Even with Altcoins, the 80% threshold gave the highest returns, however unlike with Bitcoin, the 30% level was the optimal long-entry, short-exits is the 30% level.

The chart below shows the strategy’s performance when 30% and 80% are used as thresholds. These thresholds would have allowed a trader to catch the start of the Altcoin rally in late 2017 and the decline in early 2018. However, it also round-trips the top (which is good because it means you exit when it is clear the market will not go higher).

The shorts basically don’t lose any money, the longs perform better and a few big trades make up majority of the gains. What’s interesting is that there are almost no drawdowns! The cumulative return chart shows exceptional performance. It’s a shame such an index doesn’t exist (but you can replicate it!)
The stats show that there were 70 trades in total. $100 invested would have gained 517, 730k. It has almost the same win-rate as the Bitcoin version (35%). Average winning trade gains 833% while the average losing trade sheds 7.5%. A winning trade takes 83 days on average while a losing one takes 10 days.

Percentage of Coins Above Their 100-DMA
The return matrix shows that the 100-dma indicator always has positive returns. This is the same as the study I did using the S&P 500. The reason for this is that it is just the right temperature: not too fast to generate noisy signals, and not too slow to be late. Its the goldilocks measure of crypto breadth.
The optimal parameters are 10% and 70%—similar to Bitcoin—which returned 7922%.

Looking at the trades generated by the optimal thresholds, you see that this indicator catches the starts and ends of Altcoin market cycles almost perfectly—sometimes too early. But one big trade, that gained 5 digit percentage returns, helped a lot. That the return of this combination is well below that shows that some drawdowns ate the profit, and indeed the drawdown chart confirms this.

There were 62 trades generated by the indicator. $100 dollars initial capital would be worth $205k in December 2024. It has a win-rate of 34%. The average winning trade gains 630% and the average losing trade sheds 5%. A winning trade takes 95 days on average and a losing one takes 7 days.

Percentage of Coins Above Their 200-DMA
The 200-dma version performs better in Altcoins that crypto. It is still late, and severely round-trips a top, but it benefitted from the 2017-18 Altcoin rally. The optimal combination of thresholds is 30% and 55% (83% return).
The optimal combination’s trading performance is shown below. The winners outperform the losers, and one big trade is responsible for a big chunk of the returns.

This strategy’s problem is the large drawdown. It has a higher win-rate (38%) and the average winning trade gains 408% while the average losing trade sheds 26%. But its max drawdown, that occurred when the Altcoin bubble of 2017 burst, is 1837% and lasted 2292 days (6.2 years). That means you would have

Conclusions
The percentage of coins above their 50-dma is king. It reacts the fastest and catches sentiment shifts early, and is therefore the best for identifying when momentum has hit a critical mass—both upwards and downwards.
80% is the magic number. When 80% of coins are above their 50-dma, Bitcoin is near the top. Close longs and consider shorts.
The optimal strategy for Bitcoin involves using the 20% and 80% thresholds for the percentage of coins above their 50-DMA. This strategy captures the majority of Bitcoin's rallies and declines, resulting in a return of 847% from 2015 to 2024. However, it suffers from significant drawdowns, particularly during prolonged bear markets like the one from late 2021 to early 2023. However, this strategy beats buying and holding Bitcoin.
The main challenge is round-tripping tops and enduring huge drawdowns. The best strategy had a max drawdown of 113% but it still outperformed holding Bitcoin.
The 100-dma is still profitable but the returns are lower.
The 200-dma version is garbage. Ignore it completely.
Altcoins rally harder—but there’s a catch. A replicable top 100 Altcoin portfolio would have outperformed Bitcoin over the long-run, but transaction costs, rebalancing and other considerations pose a challenge.
If you found this analysis helpful, share it with someone.
just catching up on your posts, great insights, awaiting the next 20% 50 DMA altcoin cross over for hopefully last bull leg after that brutal shakeout