3 important things to know when using volatility indices
Three things about the VIX that should be common knowledge
Editor’s note: There is a lot to unpack about volatility indices so I will deluge them in a series of posts covering different things. Not sure how many.
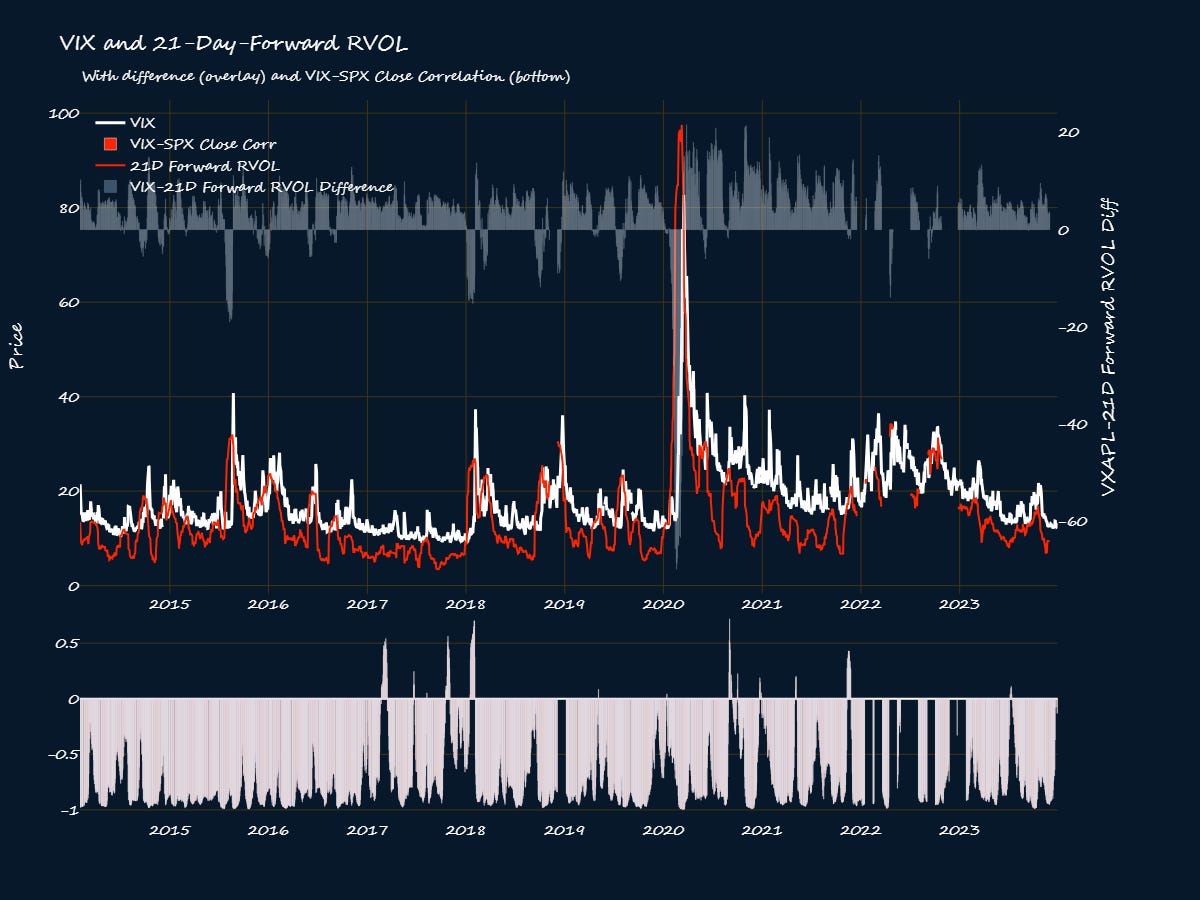
Let's start by reading the label of the damn thing. On the CBOE website, it says that the VIX is: “… a calculation designed to produce a constant, 30-day expected volatility of the U.S stock market, derived from real-time, mid-quote prices of the S&P 500 Index (SPX) call and put options.” OK. So it tells us how volatile the stocks will be in the next 30-odd days, ey ? Can it be relied on for a future volatility estimate or not? Let's see how good a job it does. Since the calculation is based on 30 calendar days, the trading days equivalent is 21 days. So today’s VIX should tell us the kind of realized volatility to expect in the next 21 trading days. Here is a chart of that.
The chart shows the VIX (white) vs the 21-trading-day-forward RVOL (red), along with their difference (grey) and the VIX-SPX rolling correlation(pinkish). The VIX does an okay job at predicting volatility. It can predict whether volatility will increase or decrease in the near future, which is a good start. But, the difference between the VIX and the future RVOL shows that it often overstates the expected volatility in normal times, and grossly understates it when the shit hits the fan. This is a well-known stylized fact of volatility indices among academics1 and vol experts. The best you can do with a vol index is to know what volatility regime to expect—high or low. In addition to the overstating and understating, it doesn't do a good job at timing. That said, there are some smart people out there who know how to extract more from the VIX. For instance, a study2 found that a better way to use the VIX to forecast volatility is to take today's RVOL, adjust it for mean-reversion, and then add VIX's volatility premium. They show that this approach does better than using either RVOL alone or VIX alone.
You will often hear ' well actually’ arguments that VIX is not actually volatility, and most of these arguments are theoretically sound. Truthfully, the volatility formula used in the VIX methodology is not an approximation of implied volatility. To derive it, you start with the formula for the forward price of a stock, then you solve for the volatility parameter and expand some terms so that the sum of call price and put prices comes into play. Then, you discretize it and use real-world options to estimate the volatility parameter. Implied volatility has nothing to do with it, even though options are used. But, as the chart shows, the VIX does indeed do a decent enough job at what it is supposed to do. Just to show that this isn’t a fluke, here is VXAPL vs AAPL’s 21-day-forward realized volatility.
Not bad at all.
#1: Volatility indices do a decent job at forecasting volatility regimes, but they consistently overstate expected volatility in normal times, and significantly understate it in turbulent times.
In the two charts shown above, I added the 21-day rolling correlations between the volatility indices and the underlying to show that this correlation is not always negative! The correlation between VIX and SPX is almost always negative to varying degrees, but sometimes, it can be positive. That of VXAPL and AAPL is more frequently positive than between VIX and S&P 500. This has broader implications for the utility of volatility indices in portfolio or positional hedging.
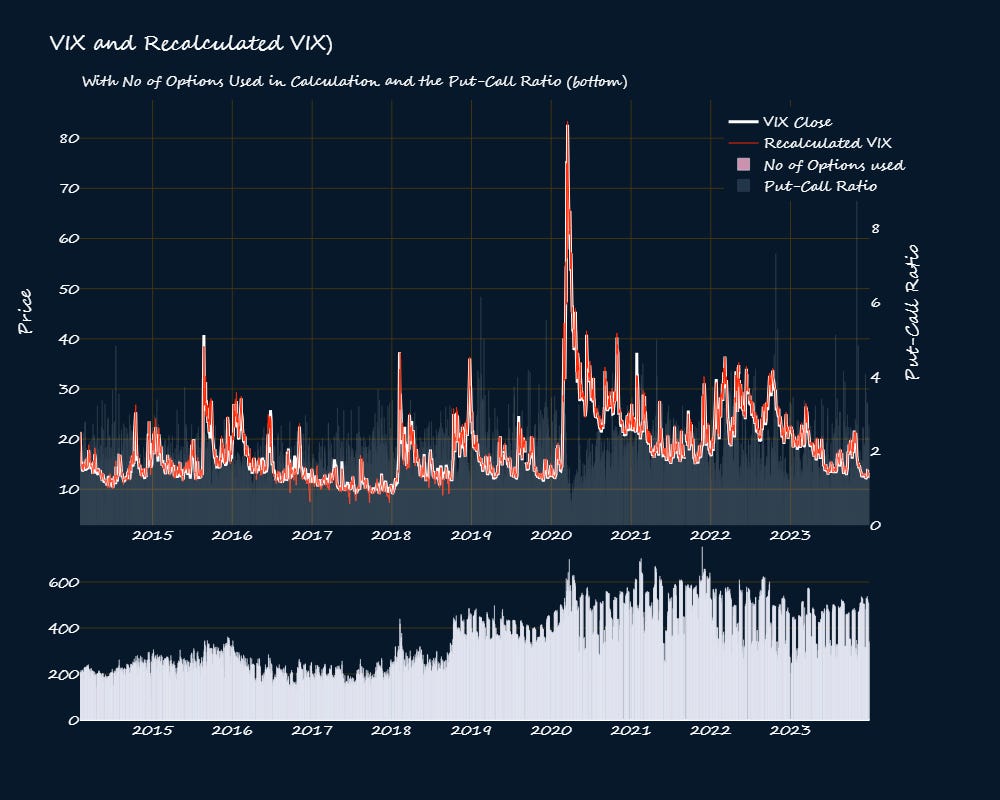
On a closer look, you will see that the correlation is usually positive when the VIX is low, and negative when it is elevated. I was curious about this, so I calculated the put-call ratios of the options used to calculate the vol-indices. Here is the chart of VIX along with the number of options(bottom) used to calculate it and their Put-Call ratio (PCR) (in grey on the background).
Curiously, when the VIX spikes, the PCR dips. Here is a zoomed-in version around the covid start.
You can see that around the covid start when the VIX spiked, the PCR dropped below 1. This means that when the VIX spikes, more calls are used to calculate the VIX than puts. The VIX methodology excludes zero-bid options and if there are two consecutive zero bids, options beyond that point are excluded (i.e. no calls with higher strikes or puts with lower strikes than the option before the consecutive zero bids). That means that it is likely the case that during market turmoil, puts become too expensive so they have fewer bids—everyone will likely be quoting an ask, however. Calls on the other hand may be cheaper hence they see more bids. There is a common assumption that puts features more in the VIX calculation because the expectation is that people buying options in crisis times are buying insurance. That doesn't seem to be the case at all. The VIX calculation features puts more prominently because the PCR is almost always higher than one in general as I show in the next chart.
Note also that the number of options used n the calculation increases for when the VIX increases .
Since the PCR I used was that of the options used in the VIX calculation, I decided to check the PCR of all available options, and the story is basically the same: PCR dips when VIX spikes. Also, notice that the PCR is often much higher than 1. This doesn’t mean the VIX isn’t a good hedge, it just means that the right time to buy portfolio insurance is when the VIX is low and the correlation between the VIX and the underlying is positive. Osstrieder et al note that a likely explanation for this is that as the index falls, so does the at-the-money strike so more calls that puts will be out-of-the money.
#2: The right time to buy portfolio insurance is when the VIX is low and the correlation between the VIX and the underlying is positive.
We’ve seen that the VIX is not always inversely correlated with the underlying. Instead, correlations are often negative, but can become positive when the VIX is low. We've also seen that the VIX does indeed give a rough idea of the future volatility in the next 30 days or so. One problem with the VIX, which is a big problem for volatility trades, is that the VIX rarely gives a warning signal. When things turn sour, the underlying dips and the VIX rises at the same time. The best way to use the VIX is therefore as a real-time ‘fear gauge’. But, sometimes the VIX overreacts and a good thing to do is to always check what VIX futures are doing as well, especially the front-month futures. If the VIX spike has some merit, the front-month VIX futures should follow suit, and if not, they ought to stand pat. Here is a chart of the VIX and the 1 and 2-month futures.
The main chart is the VIX (white), 1-month(red), and 2-month futures (blue). The blue line is almost always higher than the red line which in turn is almost always higher than the white line. That's because VIX futures trade at a premium to the VIX to compensate anyone shorting volatility for taking on the risk of a spike. However, there is a time when this relationship inverts: when there is a significant spike. Here is a zoomed-in version—look at the circled spikes.
In the background, you see the difference between the VIX and the 1-month VIX futures. Usually, this difference is negative, but when the VIX spikes, the difference is positive as the VIX leaves the 1-month behind. The way to tell if such a spike is meaningful is if the 1-month also spikes to catch up with the VIX. That happened in Circle 1 but not in Circle 2. The subplots are VIX-1-month-future correlation and VIX-SPX correlation. They are almost mirror images of each other—when the negative correlation between the VIX and the S&P 500 wanes, so does the correlation between VIX and the 1-month futures.
#3: Always look to VIX futures to validate a sharp change in expected volatility. If the short-term futures follow the VIX, that is a sign that the change is meaningful, otherwise it is likely an overaction.
That’s all for this post. If you know someone who would benefit from it, please share it with them.
Other posts in this series will cover:
The relationship between VIX (30-day expected vol) and other ducation VIXs (9day-1year).
Using CFTC VIX futures positioning data.
Backtesting various signals from the volatility space.
Other ways to use volatility indices as a trader.
How to make volatility plays i.e. what to look at and what to trade
Some interesting things to know about volatility indices and their derivaties plus how the VIX is calculated.
There will be supplementary charts to the ones in this posts for paid members (will notify you via chat when they are ready). Please consider subscribing to access these and other paid perks, or just to support my work :)
The futures data I used in this post and in the upcoming backtesting one was provided for free by Brent Oaschoff who is a veteran vol trader and runs VolatilityTradingStrategies.com. He also has a youtube channel where he goes over many things vol-related.
C. Kownatzki, “How Good is the VIX as a Predictor of Market Risk?,” 2016.
H. Preston and T. Edwards, “A Practitioner’s Guide to Reading VIX,” 2017.


