

[TradingView Indicator] VIX-Implied Trading Range
A TradingView indicator that plots the VIX-implied (or other vol index) trading range for a chosen asset
Update: Added more vol indices: MOVE(Bonds), SPIKE(SPY), and OVX (Oil).
The indicator calculates and plots the trading range implied by the previous day's VIX (or other vol index close) and previous day's asset close. You can choose from different vol indices, use any asset in the chart and choose how many standard deviations to plot. Here are some screenshots.
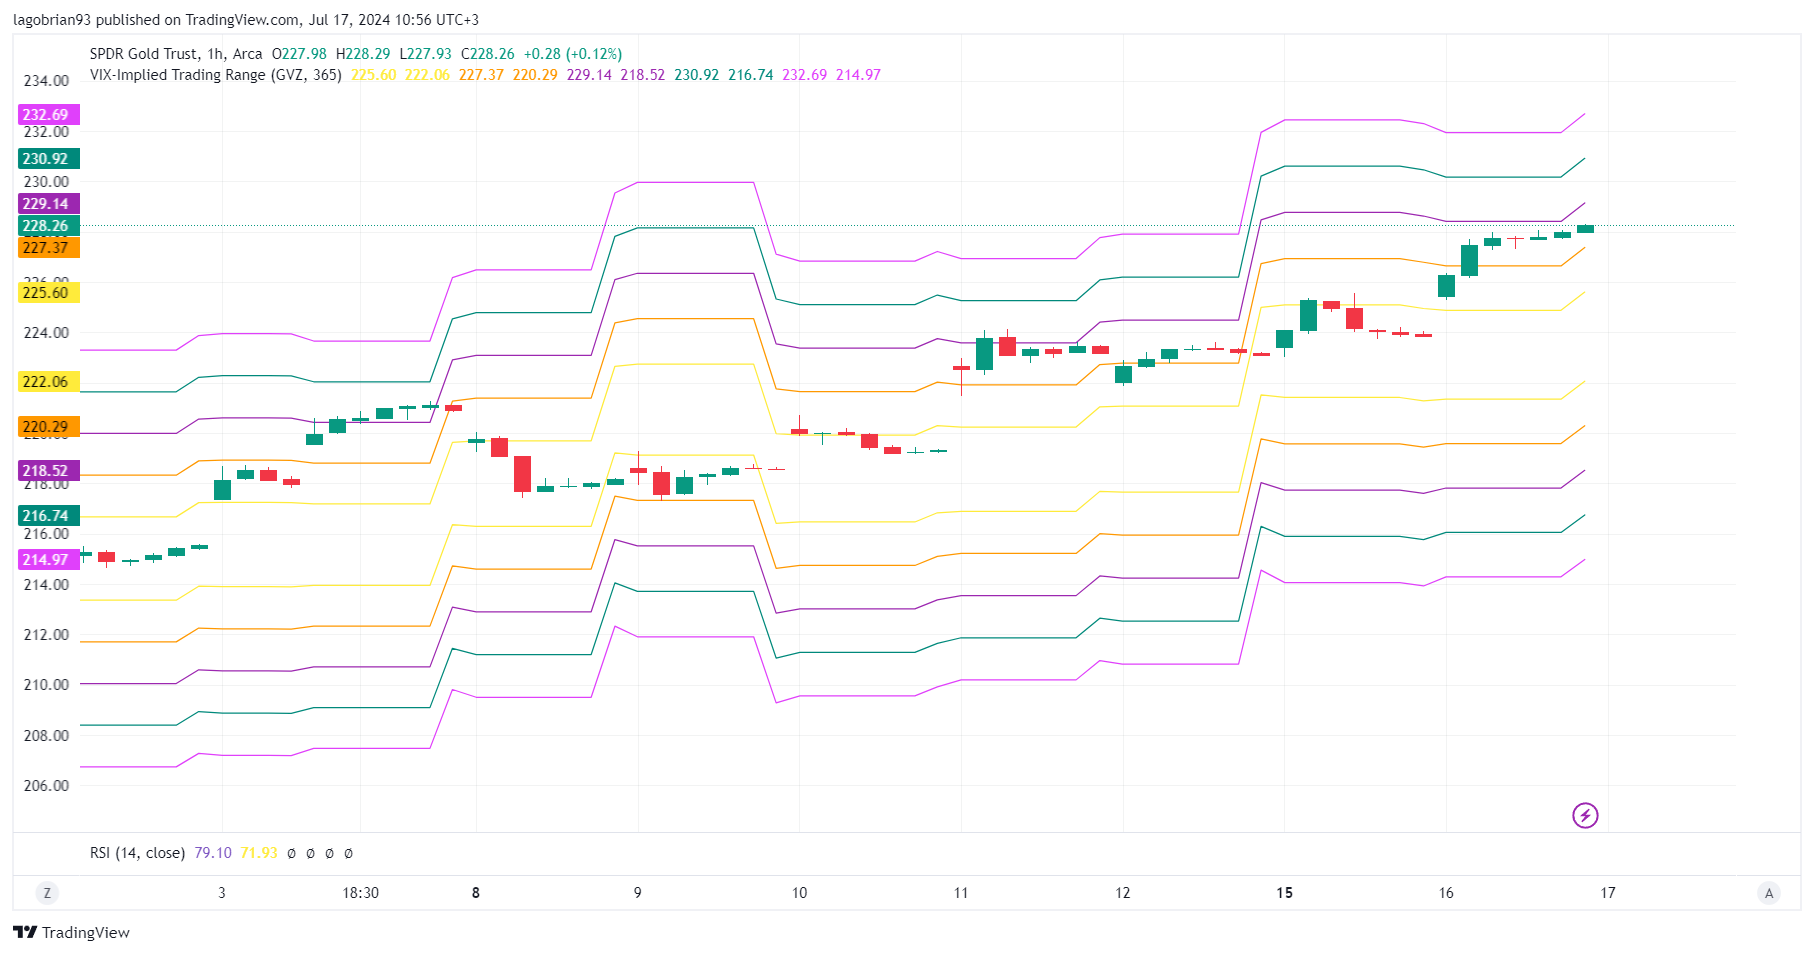
Gold is 2 standard deviations above the GVZ-implied upper bound.
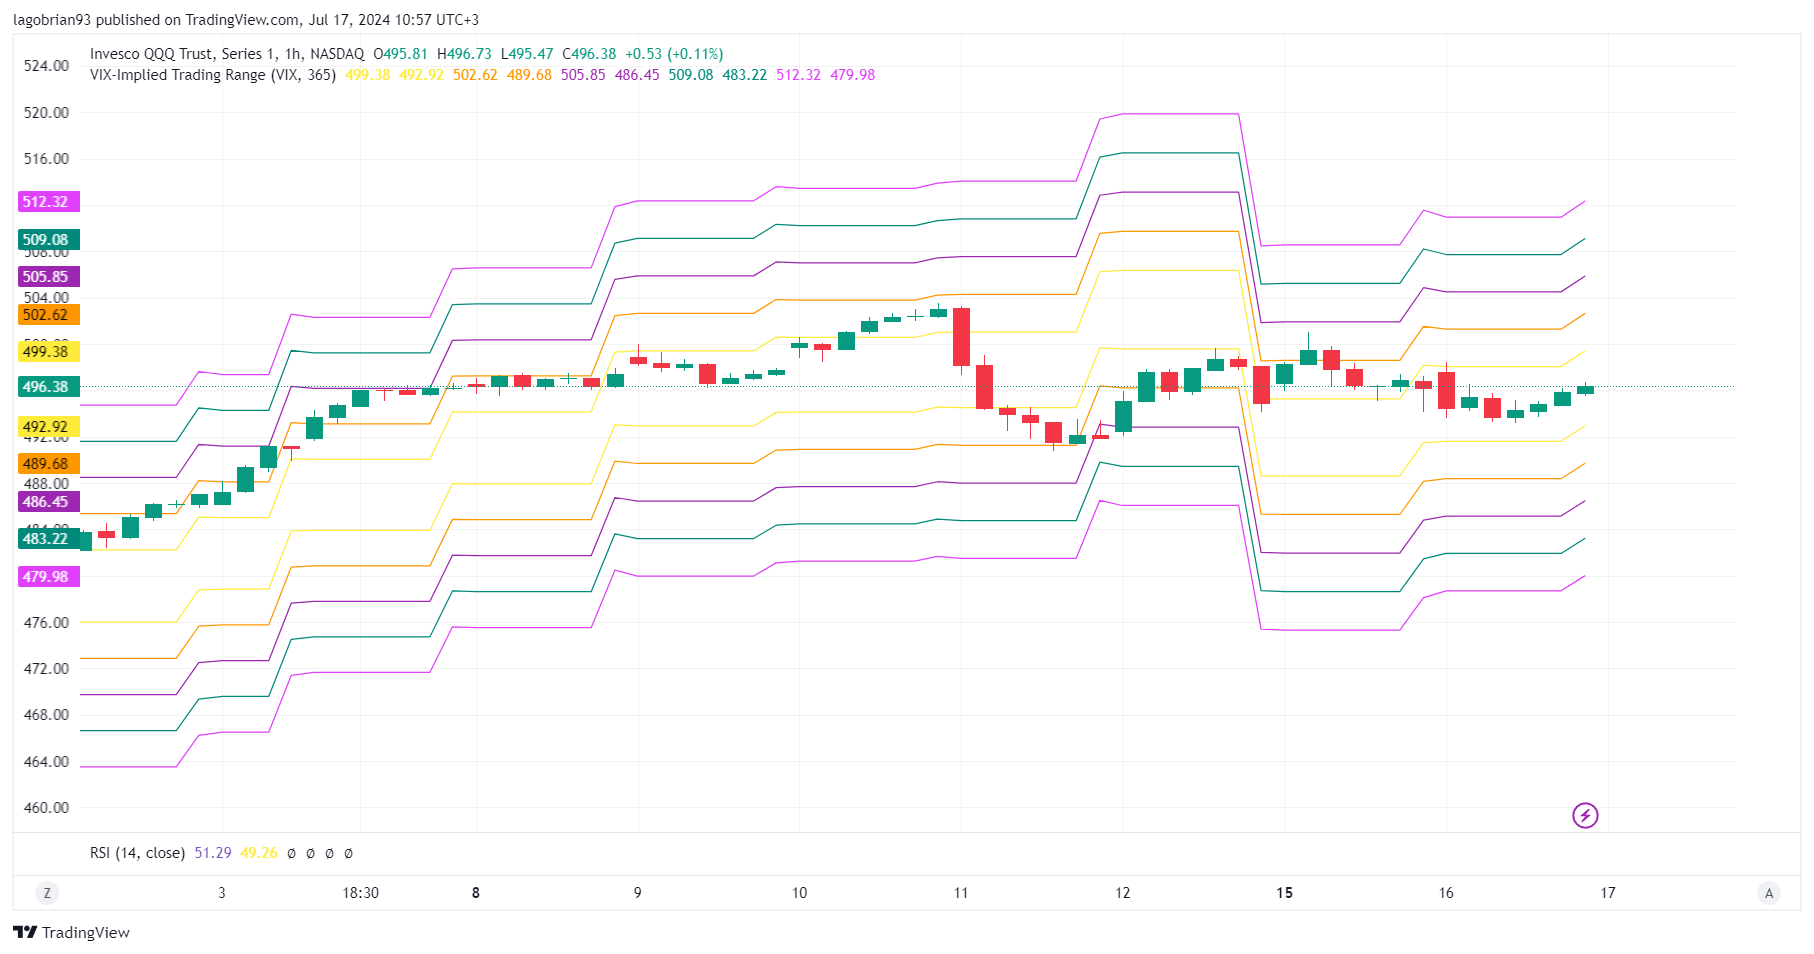
QQQ firmly in the range implied by VXN.
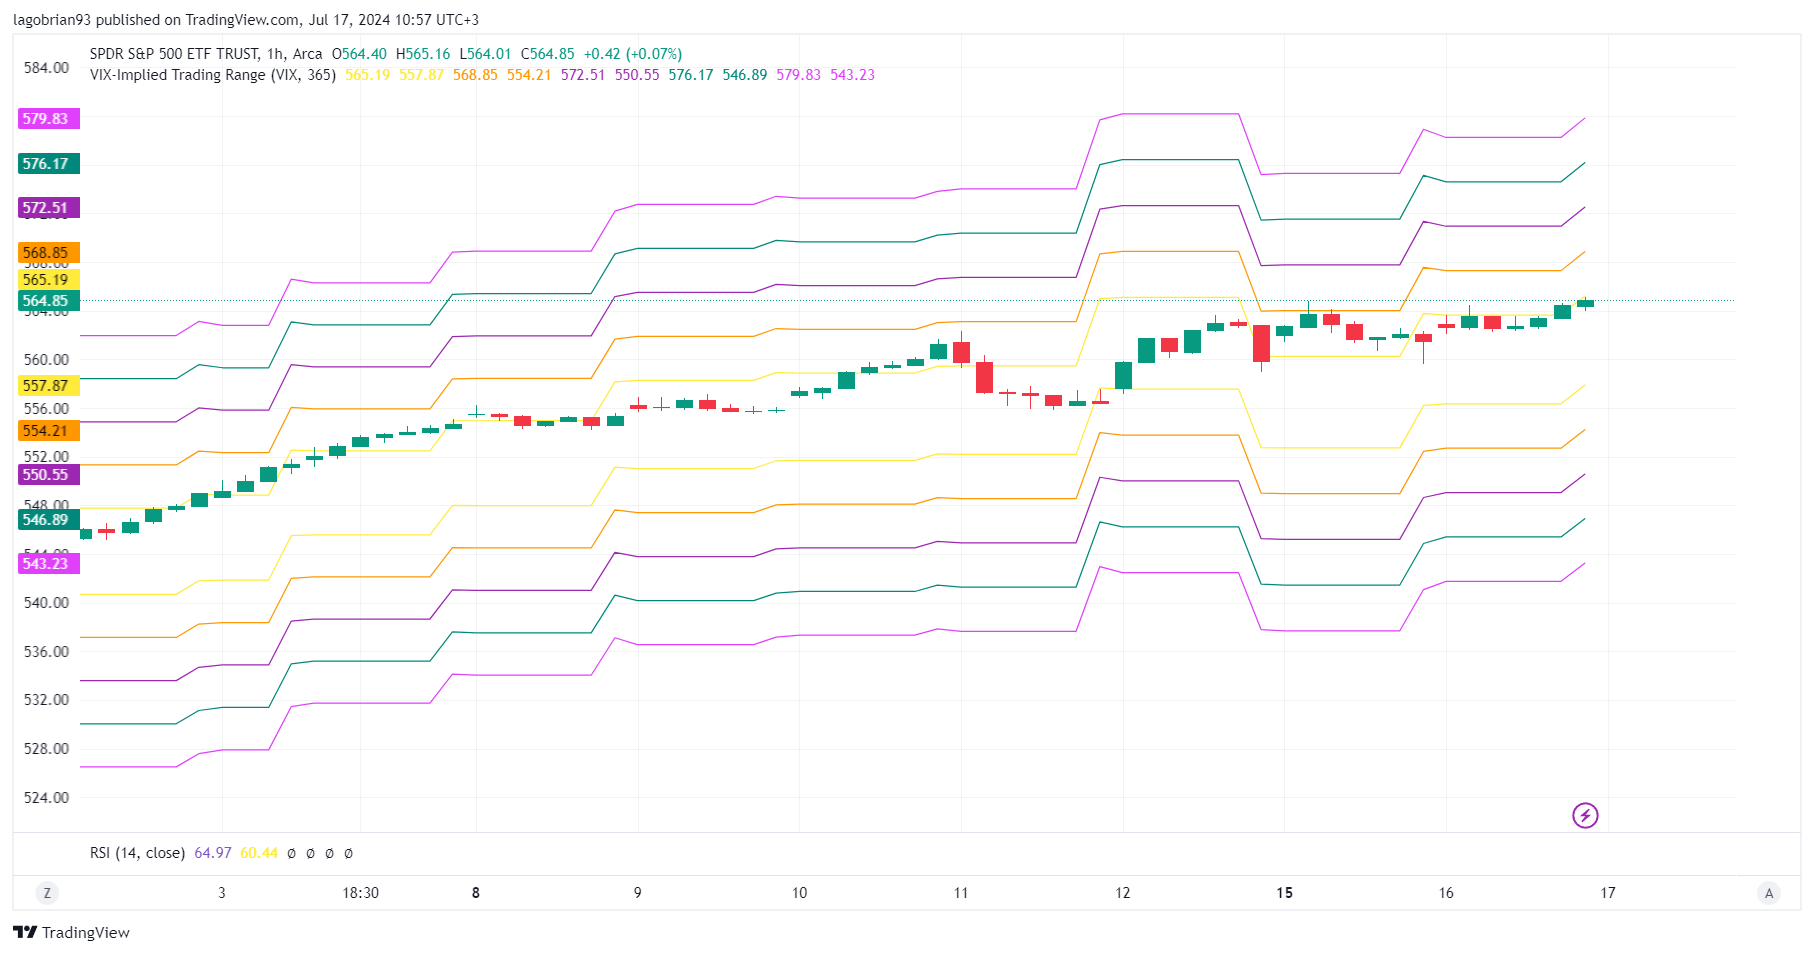
SPY hugging the upper bound implied by the VIX.
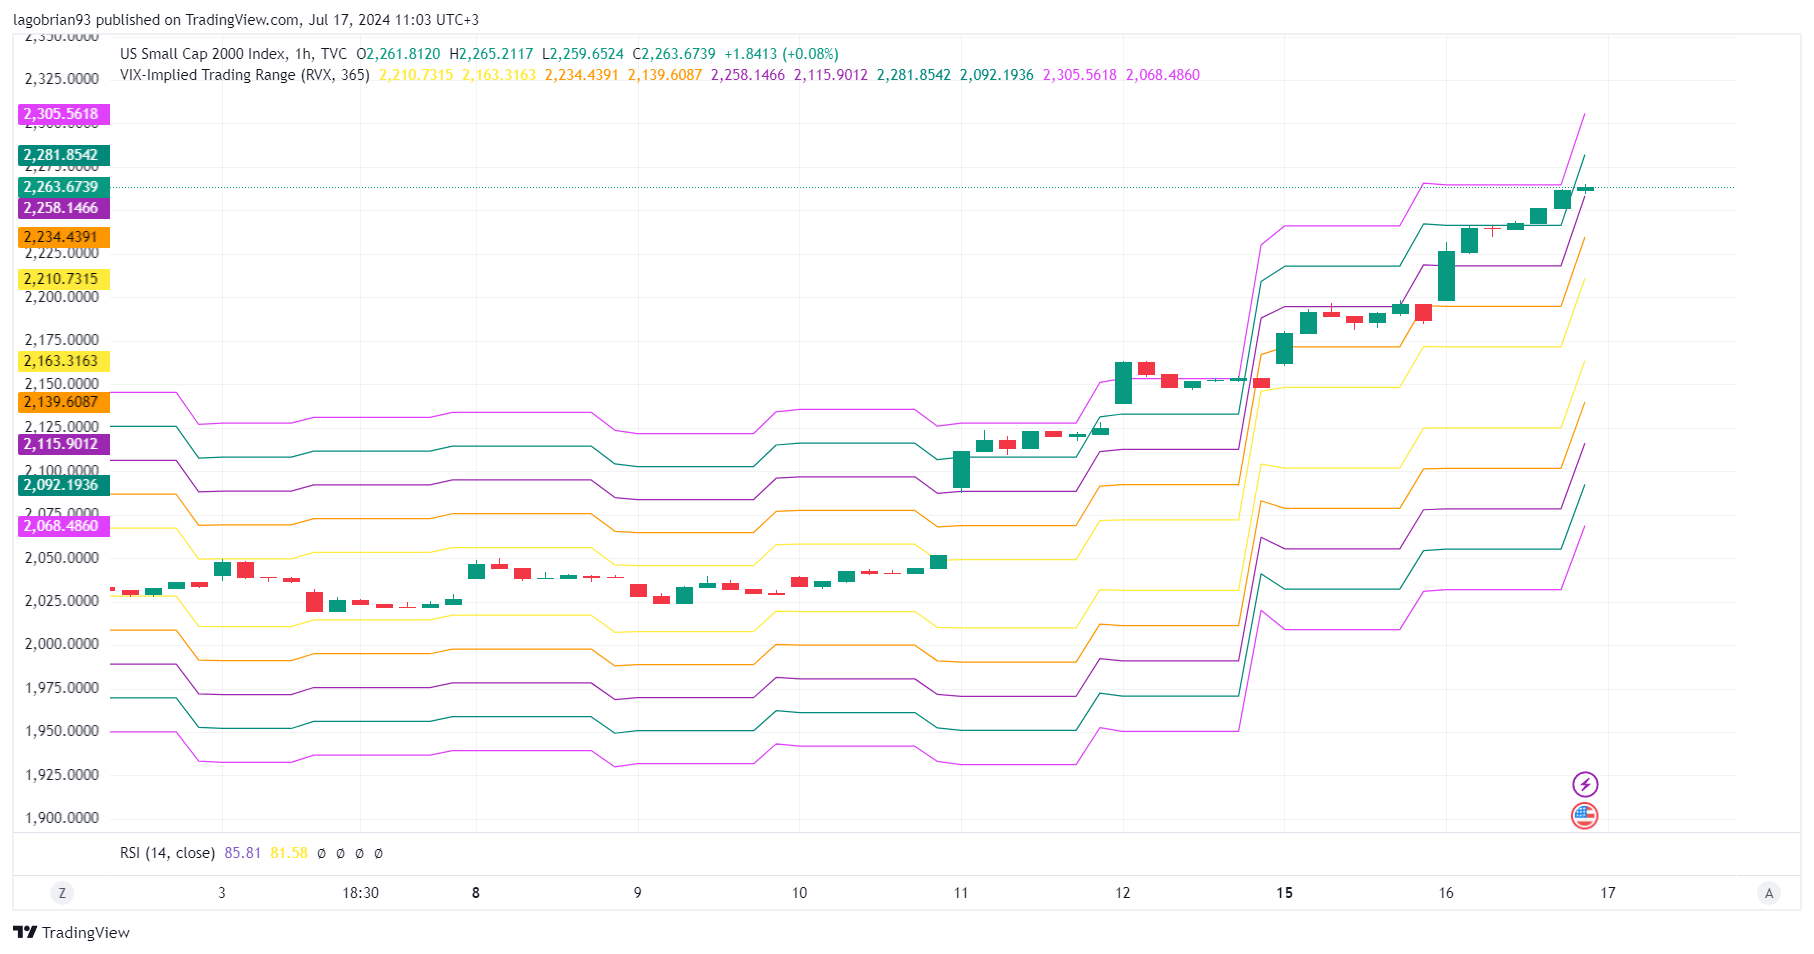
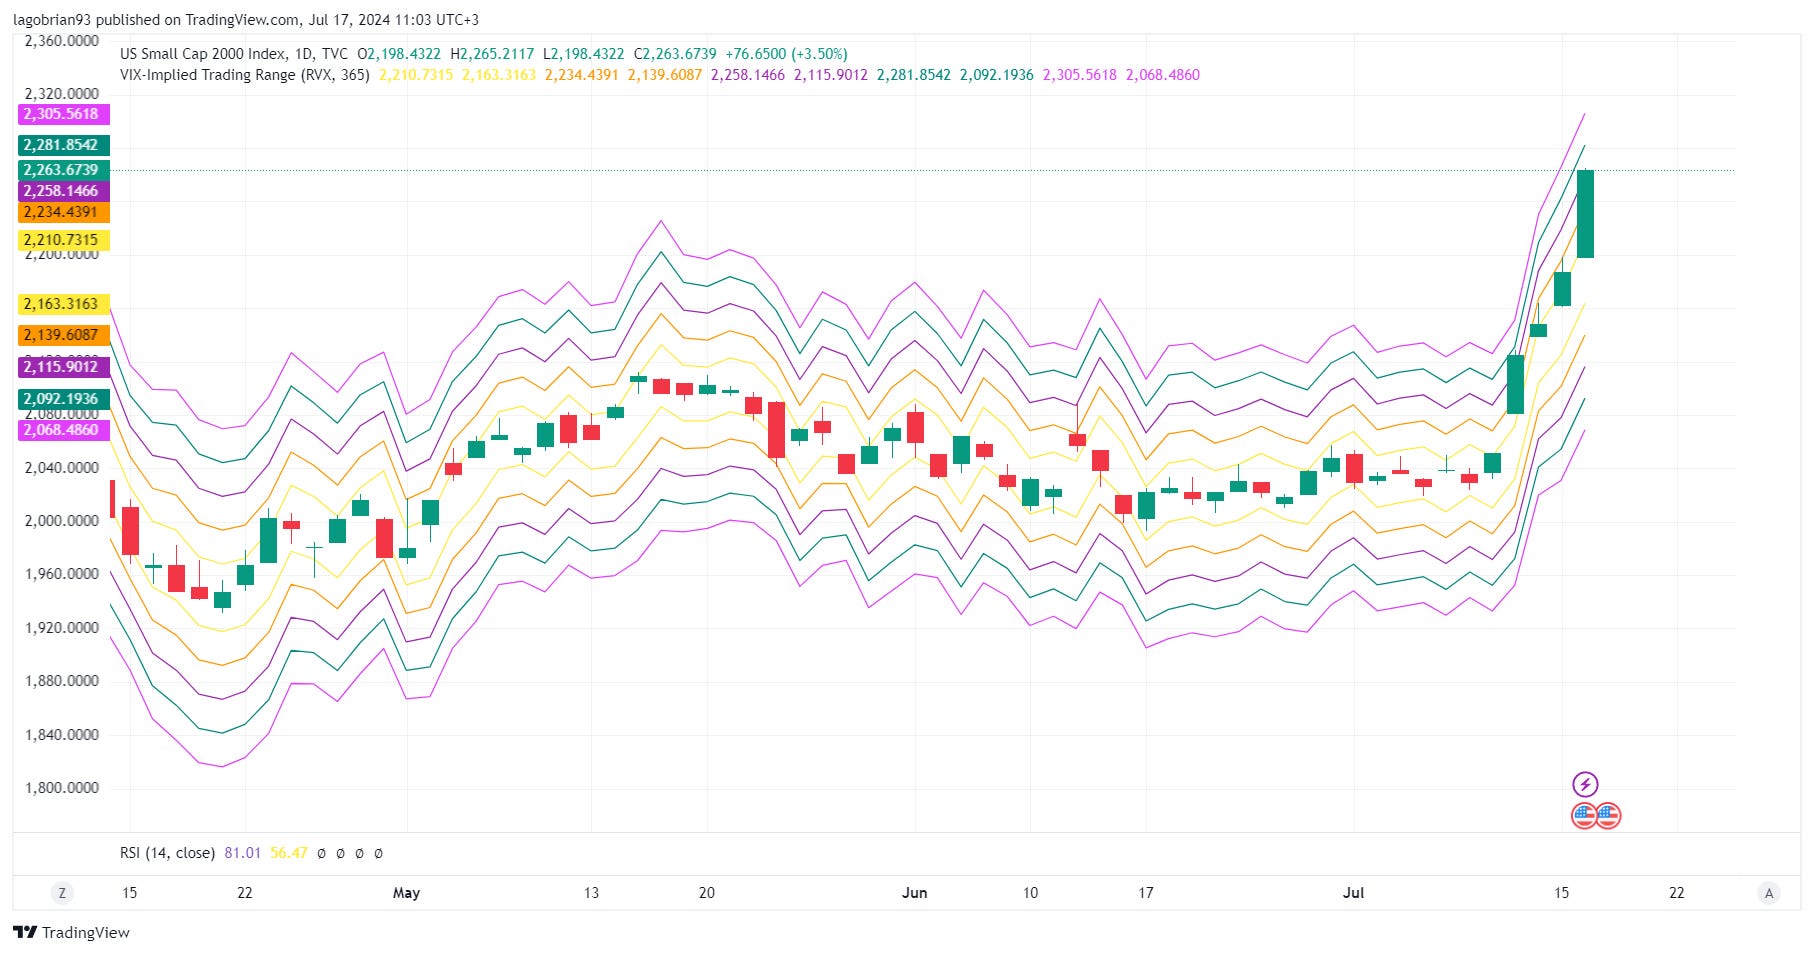
The Russell 2000 is 4 standard deviations above the RVX implied range! Reversal today?
The link to the indicator is beyond the paywall.
Keep reading with a 7-day free trial
Subscribe to Quant (h)Edge to keep reading this post and get 7 days of free access to the full post archives.