

Finding Single Name Representatives of S&P 500 Sectors Using Vine Copulas
Code and Supplementary Data Included
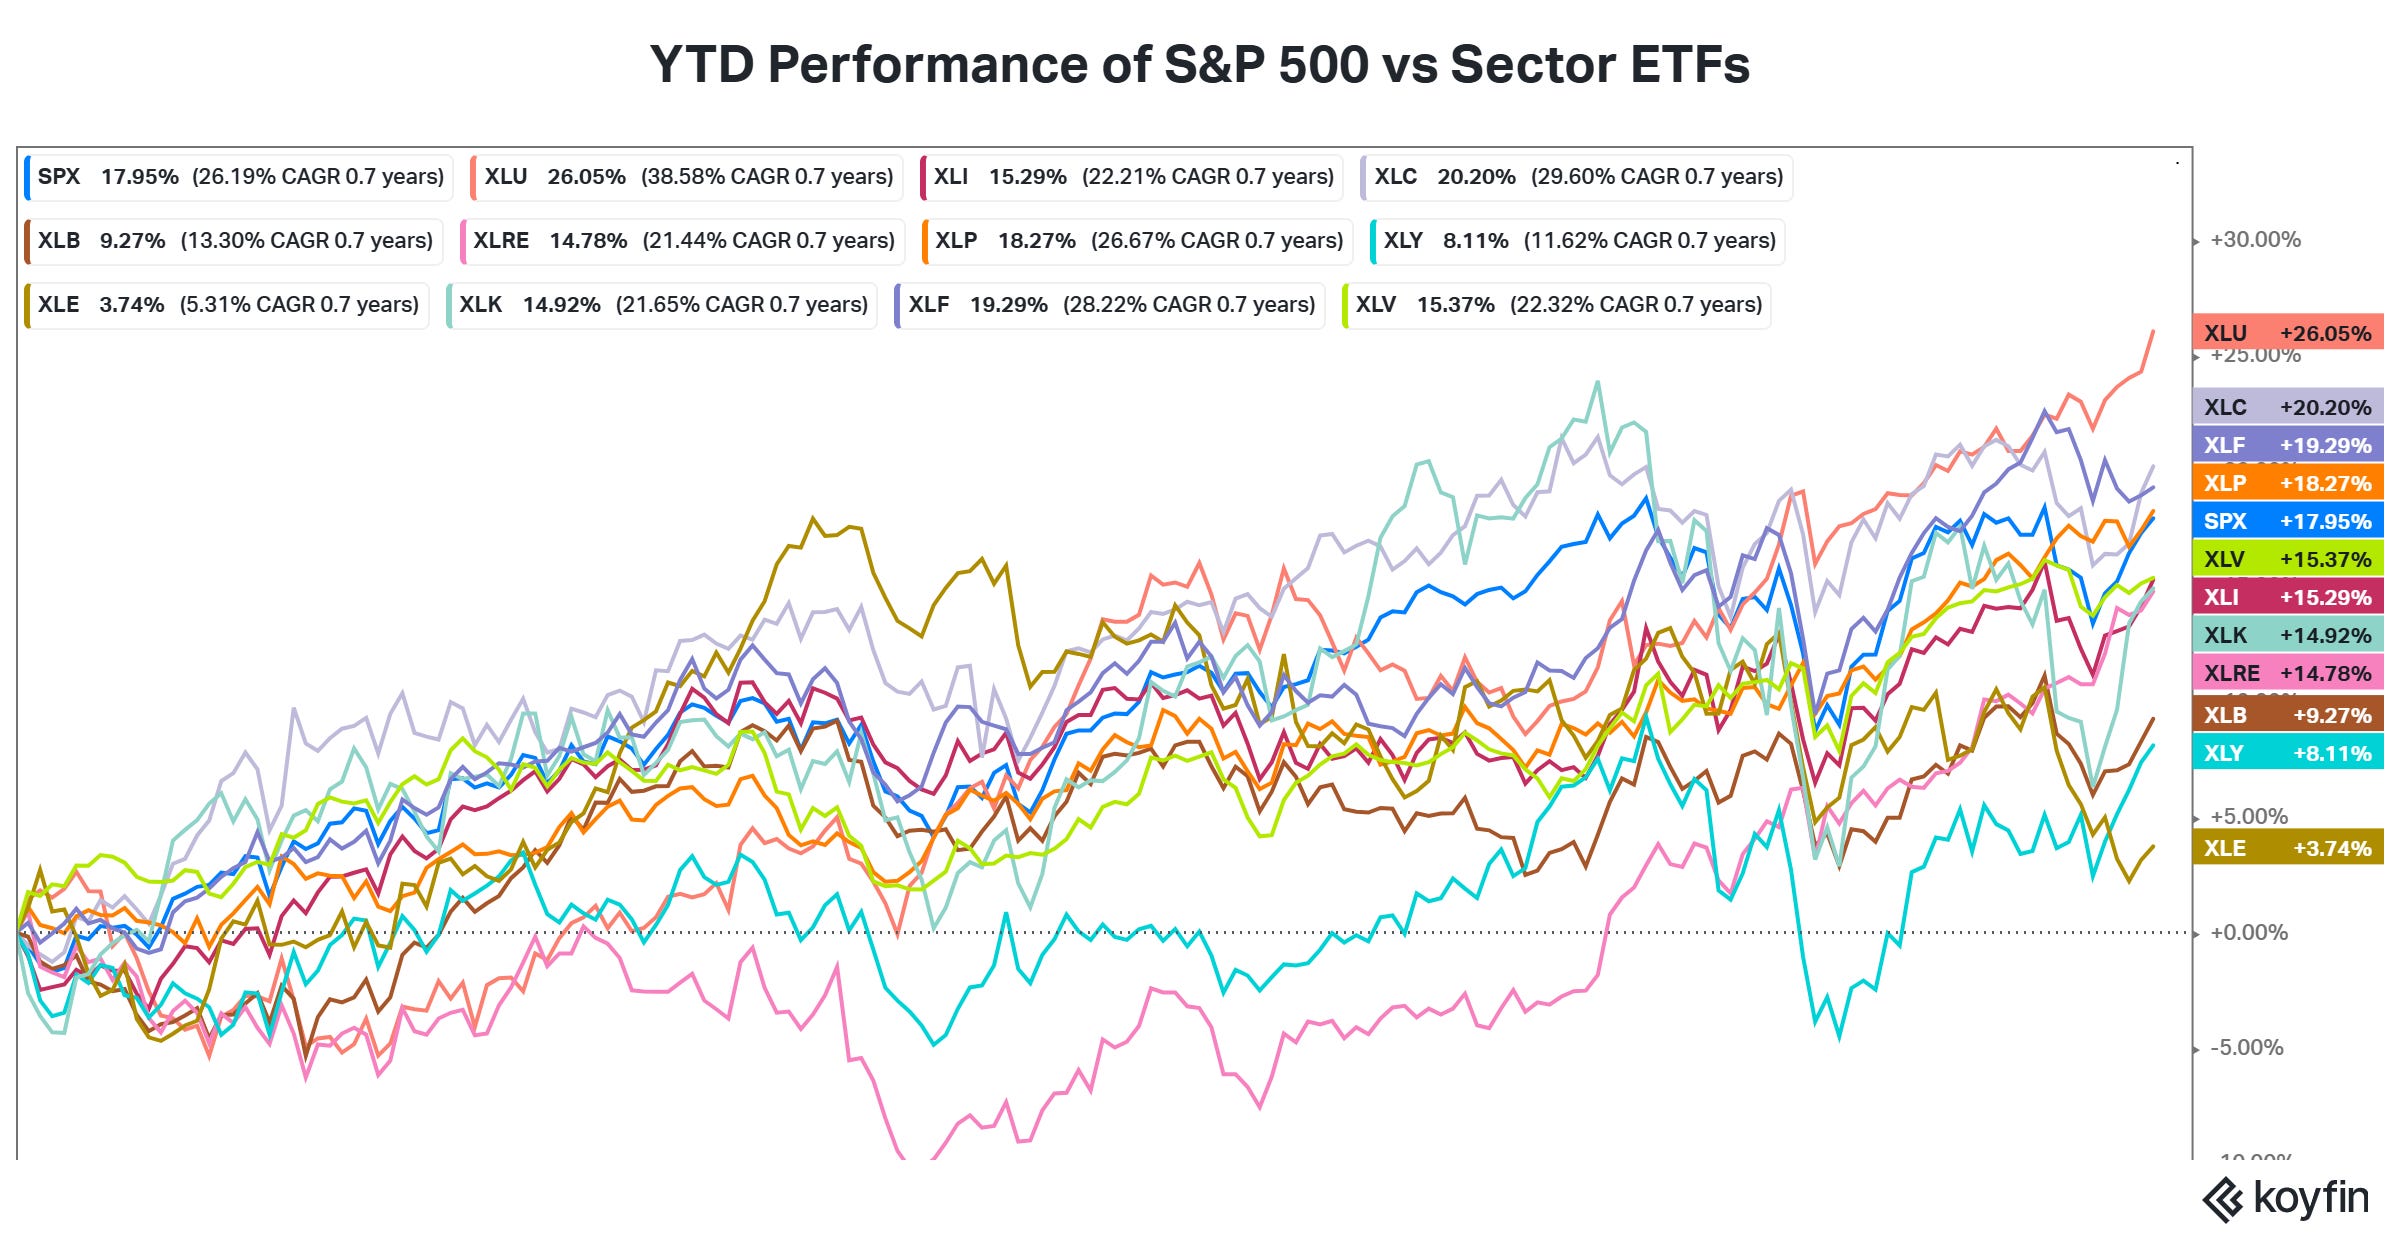
According to data by Koyfin, the S&P 500 has gained 17.95% this year as of Friday 13th September. However, four of the 11 S&P 500 sector ETFs have outperformed it namely XLU (utilities, return=26.05%), XLC (Communication Services, 20.20%), XLF (Financials, 19.29%) and XLP (Consumer Staples, 18.27%).
It is interesting to ask if it is possible to create a long-short portfolio of the sector ETFs that would significantly outperform the S&P; I haven’t found any research of that nature, but I will leave it for another day.
For now, I was wondering if single name proxies for the different sectors would outperform the index in the short-term or long-term, giving better expressions for sector-specific plays for investors of either or both horizons. Since sector ETFs are made up of several stocks, it is not farfetched to think that each sector has at least one stock that is strongly correlated with the sector ETF but moves more than the ETF to the upside or downside. If this is the case, then it be better to simply trade the single name rather than the ETF.
Methodology
I searched around for a good way to find out and I stumbled upon an excellent methodology using Vine Copulas by Claudia Czado in her book “Analyzing Dependent Data with Vine Copulas” where she did something similar for the DAX index.
The idea is to use vine copulas to find single name stocks that are proxies for the entire sector. This can be done by gathering the returns for all S&P 500 constituents, grouped by sector then fitting a Vine copula—specifically a C-Vine copula due to its ‘star’ structure (a ‘root’ asset connected to the other assets)—to each sector and find this root (Czado, 2019). The root is the stock such that all pairwise correlations, measured by the Kendall’s tau, between it and other stocks are the highest. A comparison of the root’s performance versus the corresponding sector ETF would sow if it is indeed a better short term and/or long-term play.
In the next section, I give a brief overview of how copulas and vine copulas work. I also share a downloadable mathematical treatise that serves as an introduction to copulas and Vine copulas.
To fit a vine copula, you first need to remove serial dependence for each stock’s returns by fitting a univariate GARCH model. I used GARCH (1,1)—which has been shown to be hard to beat. This removes the serial dependence of each stock’s returns and leaves only the dependence structure among the stocks. R has a very good Vine copula package. You can fork the repo with all the code used in this analysis here: Code and supplementary data on Github.
How Copulas Work
Copulas are a neat innovation, if used with caution! This is how they work. Consider a set of assets. I will use five energy stocks: APA, BKR, CVX, COP and CTRA, using their returns since the beginning of the year to 13th Friday Sept, here are their pair plots, return distributions and Kendall’s tau correlation coefficients.
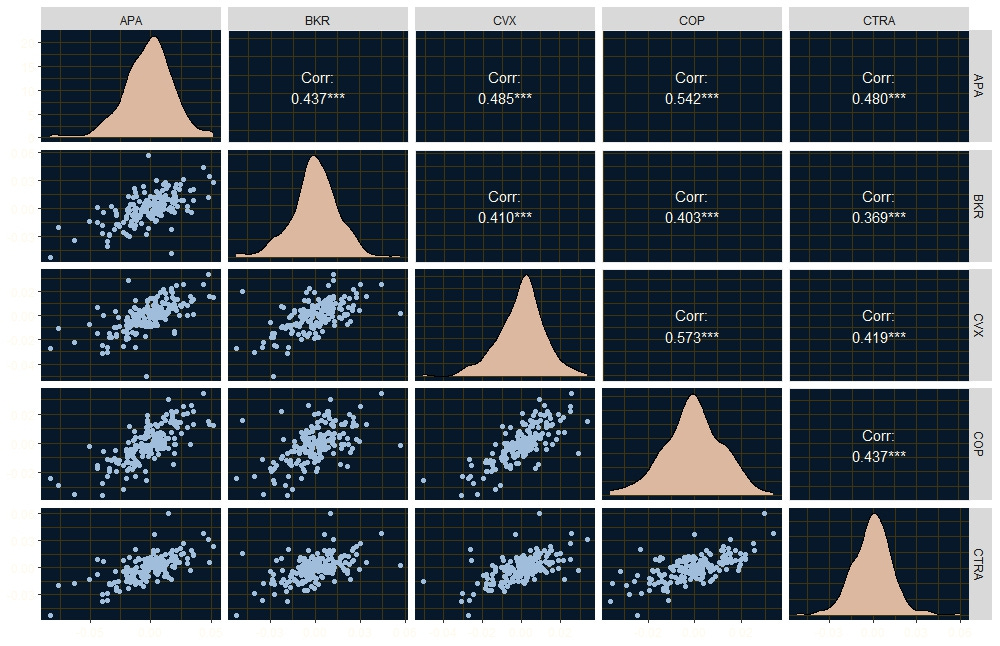
I am using Kendall’s tau because it measure’s concordance (if A moves up so does B) and discordance (if A moves up, B moves down) and makes no assumptions about the data’s distribution. Pearson’s correlation assumes normality.
They energy stocks are all positively correlated with their Kendall’s tau values all well above 0. You can also see from their pairs plots that they have positive dependencies. With copulas, the idea is to isolate the dependency structure among the assets. Notice by the distribution plots in the diagonals that each asset has it’s own unique marginal distribution. Even if you were to fit Gaussian distributions, they would have different parameters.
It is possible to apply a transformation—the rank transformation—to each of the return series so that they preserve their dependence structure. To do this, take the smallest value in each series and give it the value 1/n, and keep going until you have n/n. This way, all the return series will have values between 0 and 1, i.e. they will be uniformly distributed. It so happens that what you have done is actually create an empirical CDF of each return series, and all CDFs are uniformly distributed. Here is how that looks like.
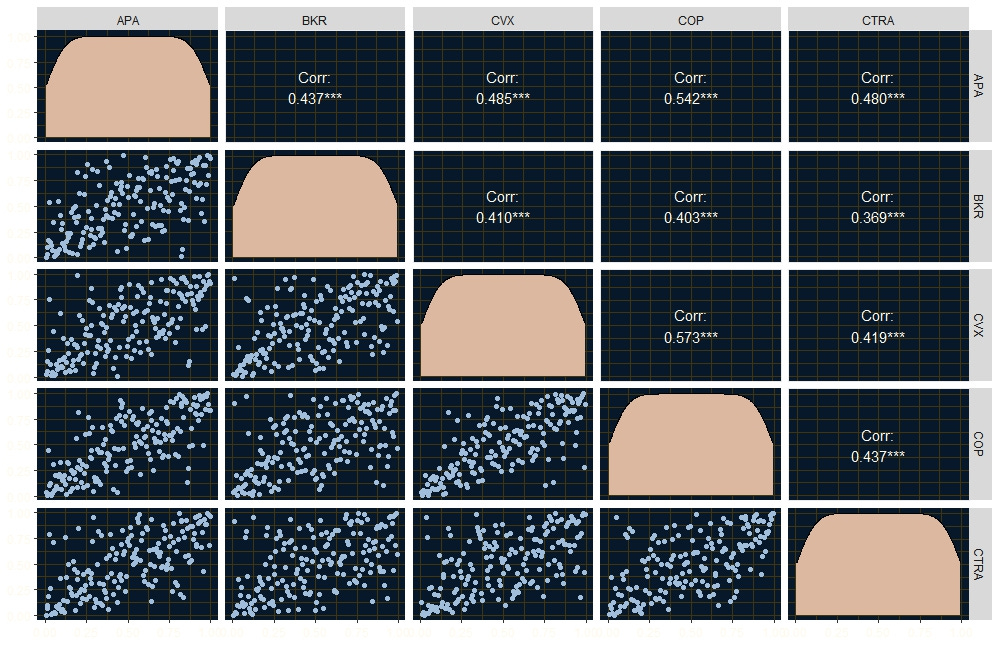
Notice that the diagonals are uniform distributions and that their Kendall’s tau values are the same—the dependence structure among the variables hasn’t changed after the transformation. The pairs plots also show this dependence structure.
A copula is a joint distribution of these marginals. A theorem called Sklar’s theorem proves that the copula of these uniform marginals is equal to a multivariate distribution of the original asset returns. What this means is that you can find a multivariate distribution for assets that follow different marginal distributions. It is useful in fields where you have to take into account factors that each have their own unique distribution, such as weather or asset returns.
Copulas also allow you to model the dependence structure among assets to account for dynamic dependencies—something which linear correlation cannot do. For example, you can model tail dependencies among different assets, which can be useful in modeling default probabilities for example.
Vine copulas extend this idea further. Using Bayes theorem, you can decompose a joint distribution into conditional distributions.
I can’t talk about copulas without talking about why they made a mess in the Sub-prime bubble. The problem is that the pricing of mortgage baskets was done using Gaussian copulas, basically a Multivariate Normal CDFs on uniform marginals, and this meant the copulas were symmetric and also assumed the tail risk of all the marginals was the same.
Editor’s note: To keep this post from being too long and to allow me to write in LaTeX, which Substack isn’t great at facilitating, I made a separate PDFs that explains in detail the mathematics behind copulas and Vine copulas. Download it below.
